
Welcome to the help files of

Part C - The "Global" Neq and rasmol script
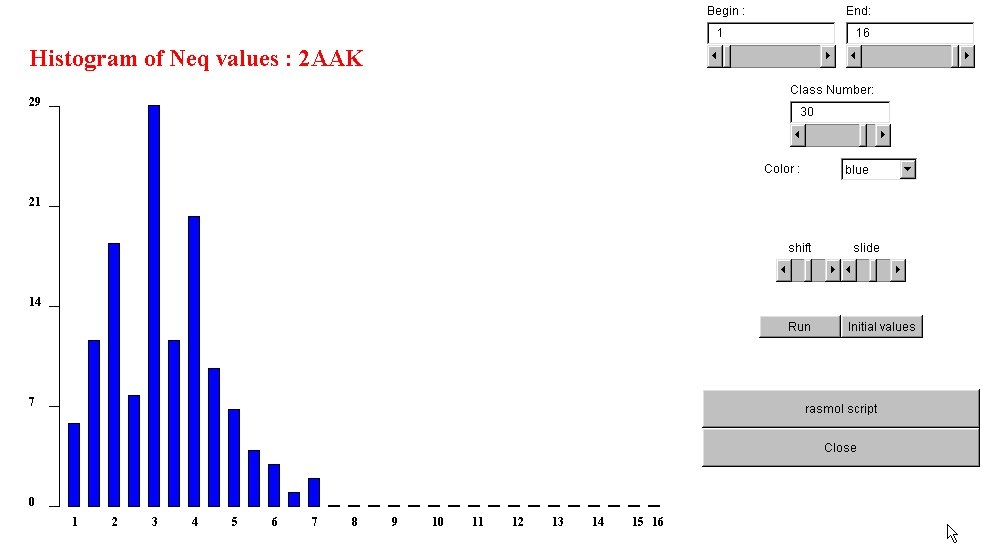
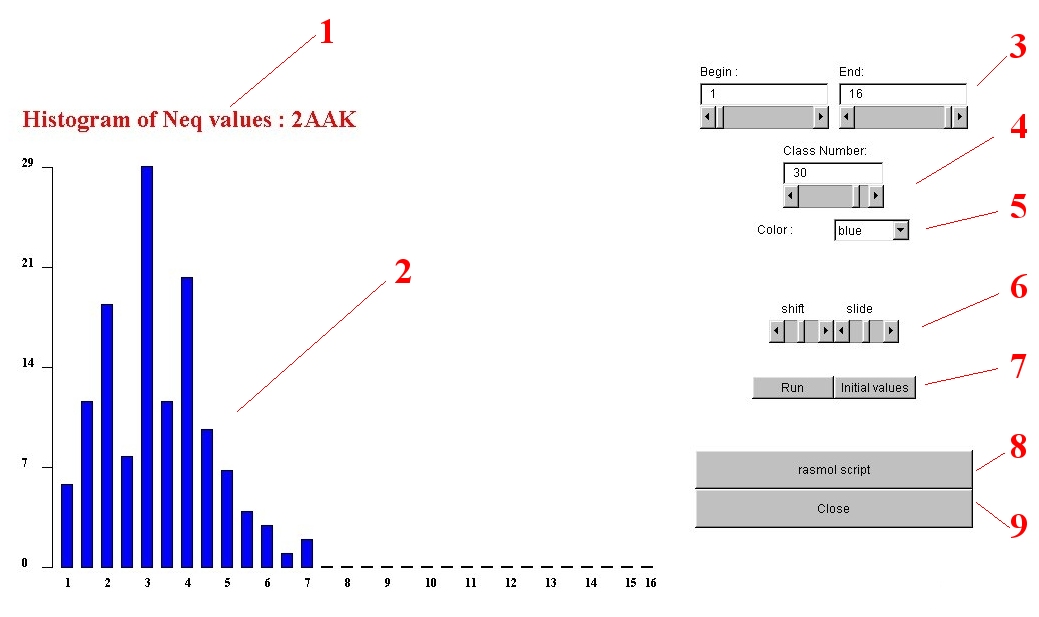
The screen which appears is a representation of the entropy-based index Neq for all
the protein sites. You could see the protein name (1),
the histogram of Neqs ranging from 1 (high informativity) to 16 (no informativity)
(2),
different scrollbars to control the histogram (3,4,7),
its colors (5), its columns (6) and
an interesting rasmol script for PDB files to vizualize the informativity
of the sequence on the structure easely usable in structure prediction methods (8).
 >
>
- title
- the name of the protein.
Top
- histogram
- Distribution of Neq values. The Neq ranges between 1 and 16, but you could modify
the begin and end of this distribution. By instance, often the Neq > 10 are extremely rare,
so a range of [1:10] is more insteresting than [1:16] (see the modified figure).
Top
- beginning and end of the histogram
- Neq ranges between 1 and 16. However, high values are not frequent, so modifying the
beginning and end of the distribution will help the interpretation.
The values less (resp. more) than the new beginning (resp. end) is associated with the new first (resp. last) cluster.
Please note that the number of clusters is important too (see the modified figure).
You can use the scrollbar or write the desired values (for this last option, please then push the
run button.
Top
- number of classes
- The number of classes can vary between 6 and 34. The X-axis gives the corresponding Neq
value and Y-axis the number of occurrences.
Please note the importance of choices of beginning and end
threshold values (see the modified figure).
You can use the scrollbar or write the desired value.
Top
5. Colors
- choice of the colors
- Different colors could be chosen (blue, black, cyan, dark gray, gray,
green, light gray, magenta, orange, pink, red, white ,yellow).
Top
- height and distance of the columns
- Using "shift" and "slide", you can control the disposition of the histogram.
Top
- run - initial values
- "run" : a new computation is carried by taking into account the new values and/or colors .
- "initial values" : to come back at the beginning.
Top
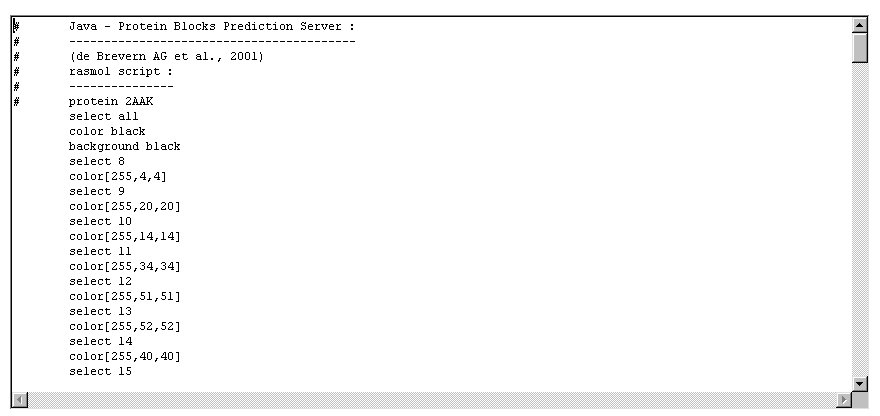
- rasmol script
- In a new window, you obtain a rasmol script. With a known 3D structure, you can visualize
the informativity of the sequence about the structure. With Unix/Linux type "rasmol -pdb file.pdb -s myscript"
or you can open the pdb file and then use the script.
This information could be useful in homology
modelling).
NB: The Neq range is defined by the beginning and end
values previously chosen.
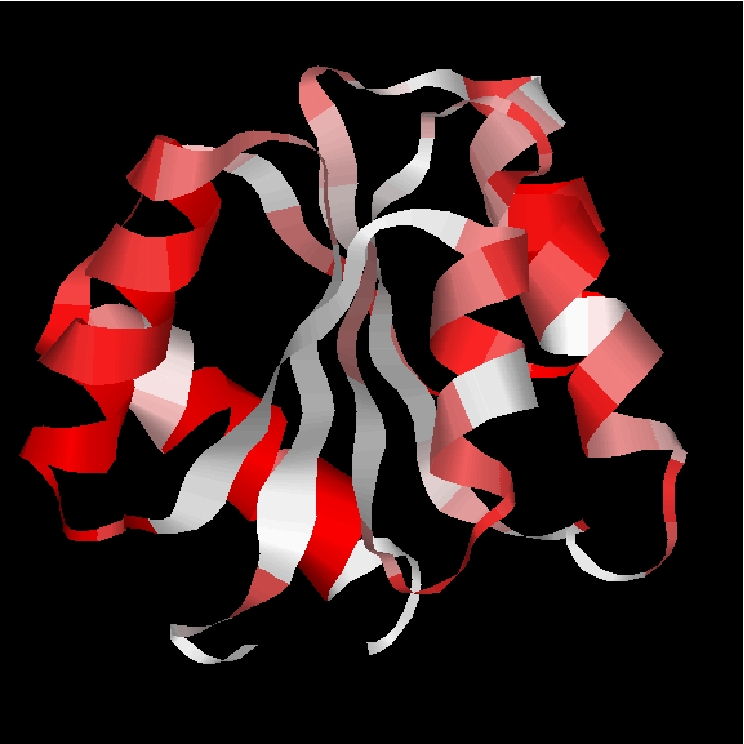
Example of protein 2aak colored for a Neq range of [1:7] (see the modified figure).
Top
- close
- Close the window, Bye.
Top
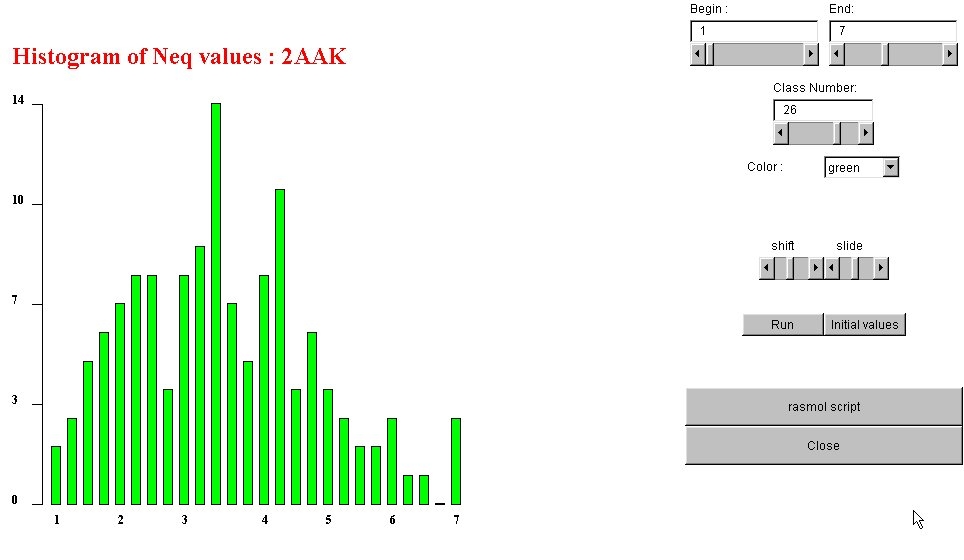
- example of 2aak
- See the evolution of Neq histogram for a new range of [1:7], 26 classes and green color.
The rasmol picture is taken from this example.
Top
back
Last modif : 25 April 2004