

Welcome to the help files of

Part D - Distribution of the Neq-values
Local and global prediction strategies.
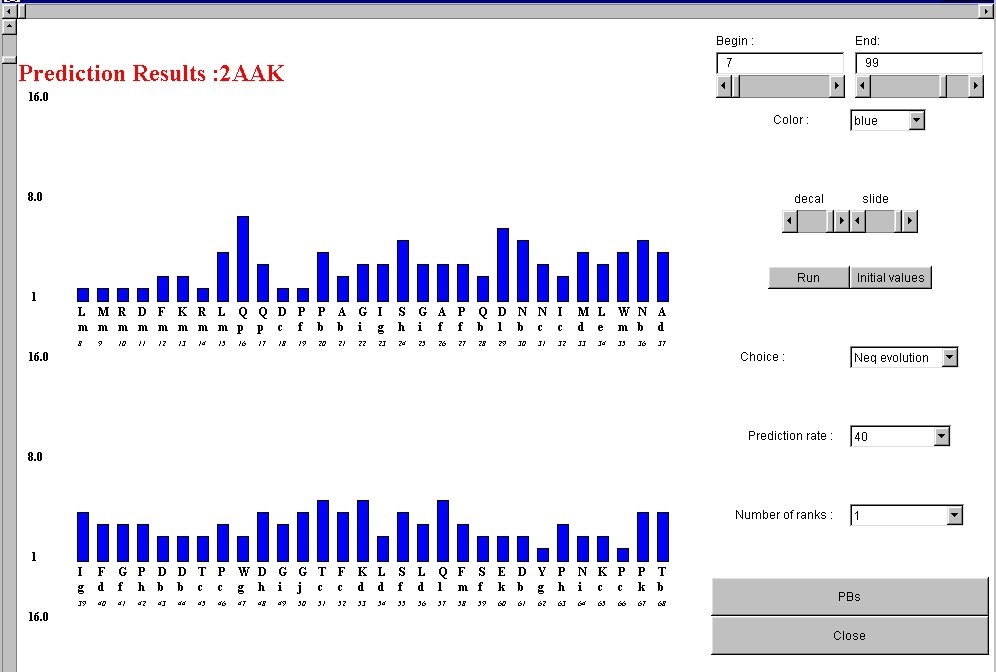
The screen which appears is a representation of the entropy-based index Neq at all
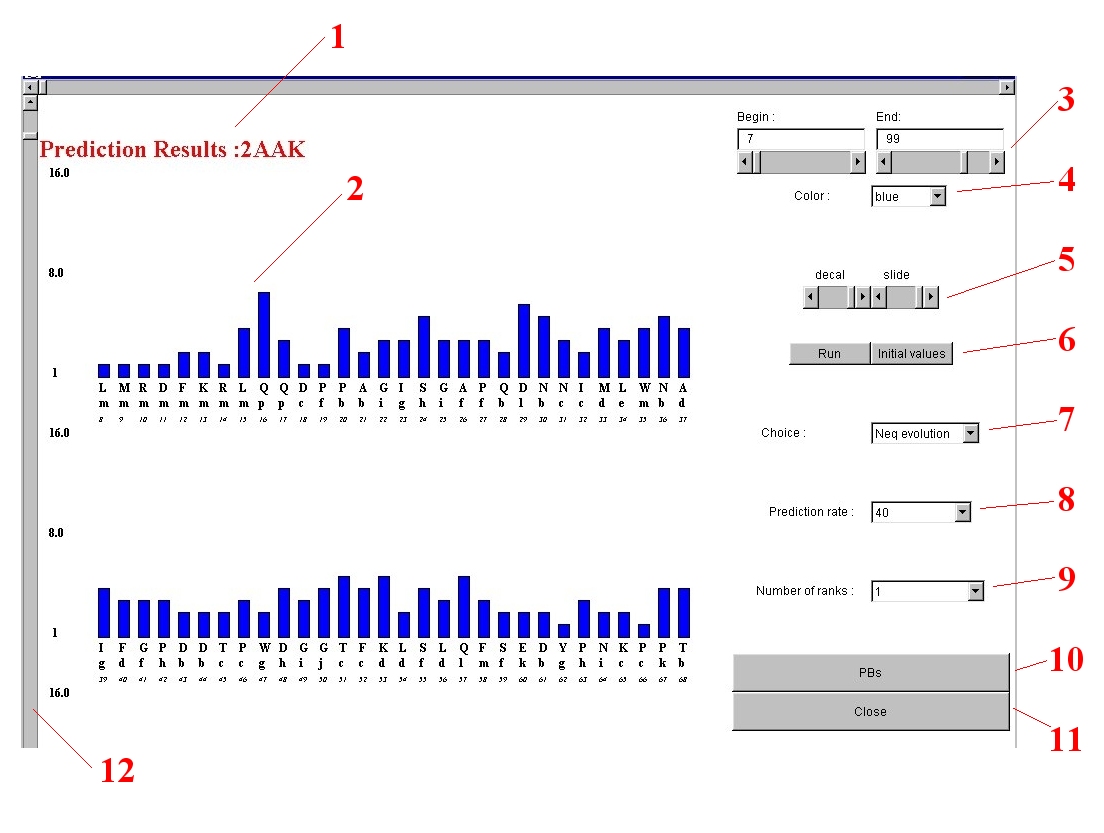
the protein sites. You could see the protein name (1),
the histogram of Neq (2) ranging from
the beggining (3) to the end (3) of the protein sites.
You could modify the colors (4),
control the histogram (5), parameter values (6).
Two prediction strategies (7) could be chosen.
They need the choice of a given prediction rate (8)
and for the last of a fixed number of Protein Blocks (9).
The results of both approaches could be vizualize in a new frame (10).
The Neq values are easely control by the vertical scrollbar (12).
- title
- the name of the protein.
Top
- histogram
- Distribution of local entropy-based index Neq site per site.
Along the X-axis are given the amino
acid sequence, the predicted Protein Block and the position of amino acid in the sequence.
At the beggining, the sequence could be represented as three succesive histograms.
The use of local or global strategy implies the only use of the first,
the second will be the strategy results.
Top
- begin and end
- The two parameters give the number of the first and the last amino acid seen. They
can be changed with the scrollbar or by using the texts. For the last case, push after the run button.
Top
- choice of the colors
- Different colors could be chosen (blue, black, cyan, dark gray, gray,
green, light gray, magenta, orange, pink, red, white ,yellow).
Top
5. histogram columns
- height and distance of the columns
- Using "shift" and "slide", you can control the disposition of the histogram.
Top
- run - initial values
- "run" : to take into account the new values and/or colors.
- "initial values" : to come back at the beginning.
Top
- local Neq and strategies
- "Neq evolution": the default option, you see the Neq values.
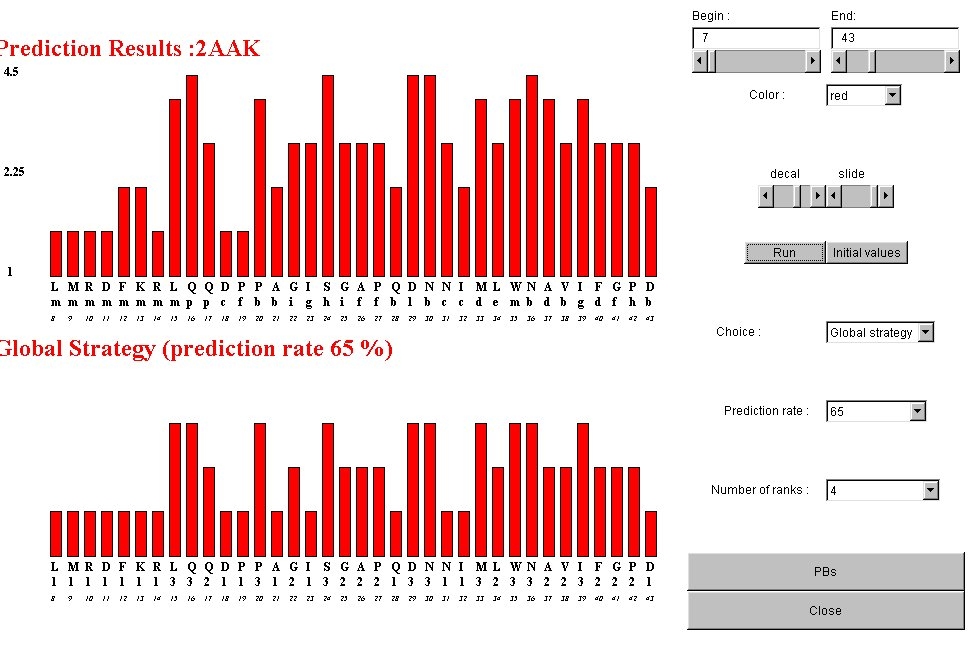
- "Global strategy" : a strategy where you can find the local structures for a given prediction rate
a variable number of Protein Blocks (don't forget to check the global strategy section,
see summary).
- "Local strategy" : a strategy which determines the sites where the local structures can be found
for a given prediction rate and
fixed number of Protein Blocks (don't forget to check the local strategy section,
see summary).
Top
8. prediction rate
- given prediction rate
- You choose the prediction rate (between 40% and 95%) for the global strategy section
and the local strategy section.
Top
- bumber of ranks selected
- You choose the number of ranks (between 1 and 6) for the local strategy section.
Top
- Principle
- The Neq values had shown a relationship between the prediction probabilities and
the probability to find the "real" local structure, i.e. the "real" Protein Block
is often found with a good score. So, when you've a small Neq, like 1.1, you have
a high probability that the true PB is the first. If you have a higher Neq to
be sure to have the true PB, you must select the 2 or 3 most probable PB.
Hence, we have calibrate this observation and found for a given prediction rate when
you have a given Neq how many PBs must be selected (see the example).
Top
- Principle
- The Neq values had shown a relationship between the prediction probabilities and
the probability to find the "real" local structure, i.e. the "real" Protein Block
is often found with a good score. So, when you've a small Neq, like 1.1, you have
a high probability that the true PB is the first. If you have a higher Neq to
be sure to have the true PB, you must select the 2 or 3 most probable PB.
Hence, we have calibrate this observation and
for a fixed number of selected PBs, we can see if the Neq
is small enough or not. The number of PBs is fixed but not all the sites are selected
(see the example). The percents of sites selected is given
under the histogram.
Top
all the options need for the strategies
|
Prediction |
Global Strategy |
Local Strategy |
| "Choice : " |
yes |
yes |
yes |
| "Prediction rate : " |
no |
yes |
yes |
| "Number of ranks : " |
no |
no |
yes |
Top
- Protein Blocks selected
- With the local or the global strategy, you select different Protein Blocks. Push the "PBs"
button and you will get those PBs.
Top
- close
- Close the window, Bye.
Top
- Neq scrollbar
- As seen with the global Neq, the Neq values could be very small.
You can with this scrollbar readjust this.
Top
Example of local strategy performed for a prediction rate of 65%.
Top
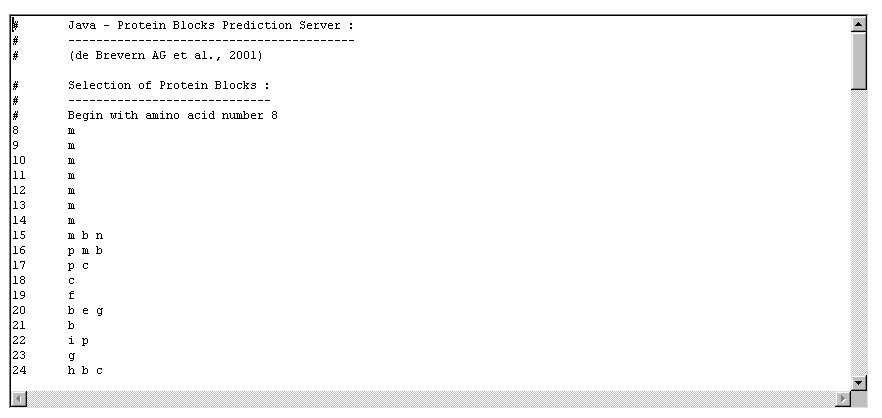
Example of the Protein Blocks selected by the
local strategy performed for a prediction rate of 65%.
Top
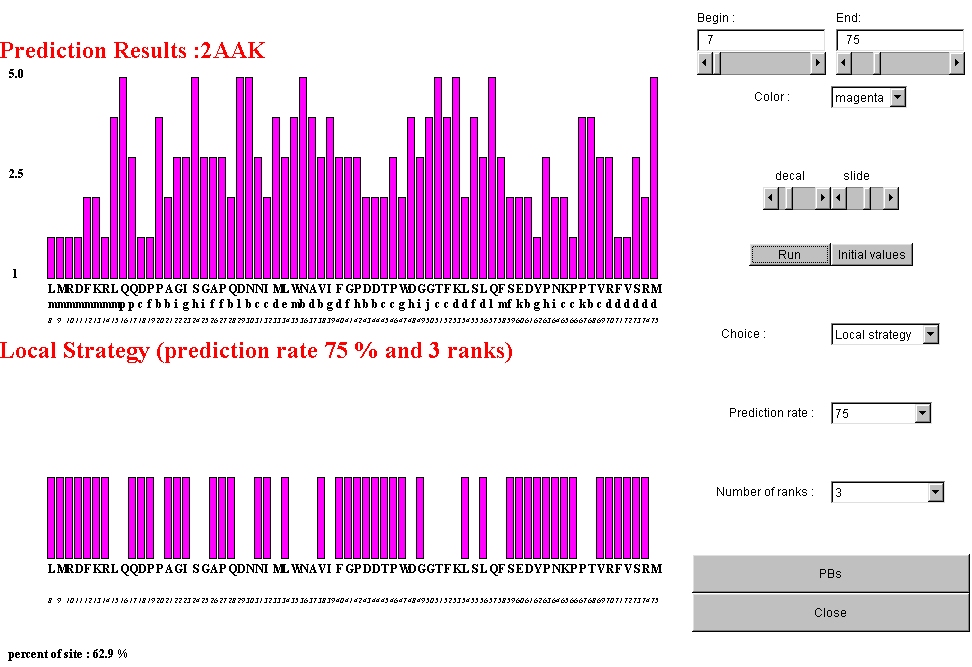
Example of global strategy performed for a prediction rate of 75% and 3 Protein
Blocks selected. 62.9% of the sites are selected.
Top
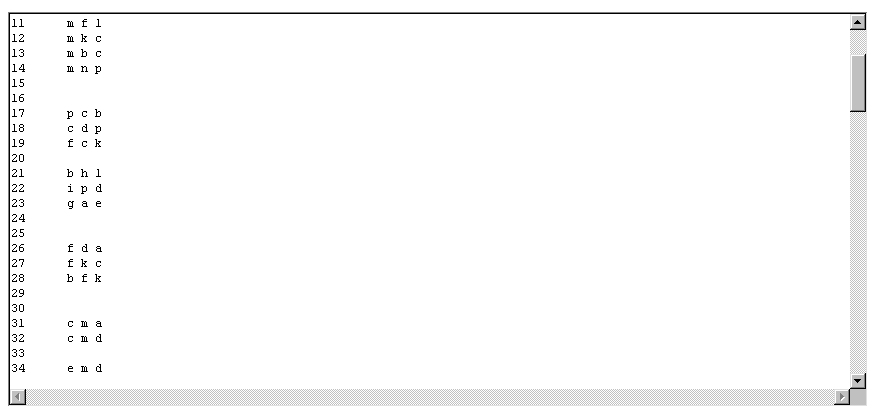
Example the Protein Blocks selected by the global strategy performed for a prediction rate of 75% and 3 Protein
Blocks selected.
Top
back
Last modif : 25 April 2004